Dear Ramesh Babu,
Since I don’t always want to bother people here with my posts, but I do think they’re important impulses, I started posting in the German forum. You can see from the page views that some topics are indeed of interest.
For example, the post about smartphone navigation has over 3,200 views.
I think these posts between FiveWin and web (mod harbour) but no SQL would otherwise be disruptive here.
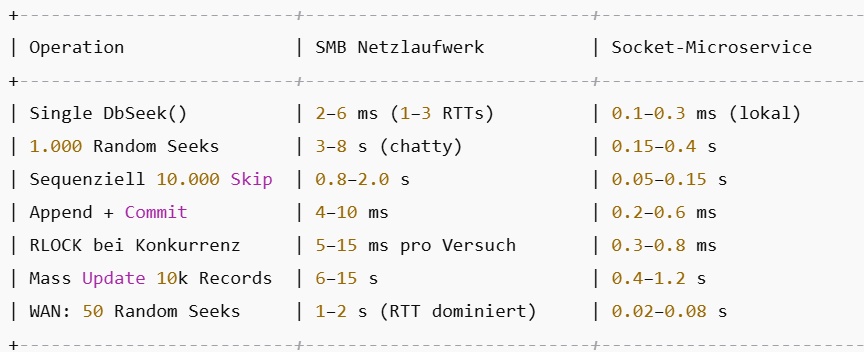
I translated the post about the speeds with AI. The line “ChatGPT” was omitted. These tables were created by ChatGPT. But since they align with my experiences and my tests, I posted them here as well.
Here, for example, is a result from my real-world use.
Kind regards,
Otto
Putting the numbers in context
Log entry:
"total_ms": 14,
"svc_ms": 13.84
→ So a single readrecord request took ~14 milliseconds.
Comparison with the table (Socket microservice column):
Operation Table (Socket MS) Your value (14 ms) Assessment
Single DbSeek() 0.1–0.3 ms 14 ms much slower than “raw” seek, but OK for a full HTTP round trip + JSON.
1,000 random seeks 0.15–0.4 s 14 ms ≈ 0.014 s extrapolated → ~14 s for 1,000 seeks (instead of 0.15–0.4 s). Your endpoint adds more overhead (HTTP + PHP).
Sequential 10,000 Skip 0.05–0.15 s 14 ms per record extrapolated → 140 s (very expensive sequentially via API; intended for a batch endpoint).
Append + Commit 0.2–0.6 ms 14 ms over 20× slower, but API overhead matters less here because append is rarely done individually.
RLOCK 0.3–0.8 ms 14 ms again much slower, but acceptable for web workflows.
Mass update 10k 0.4–1.2 s — extrapolated → very slow if you need 14 ms per record (~140 s). Solution: a dedicated batch update endpoint.
WAN 50 random seeks 0.02–0.08 s 14 ms = 0.014 s actually slightly below → advantage locally.

Interpretation
Your microservice seek (raw) is extremely fast (0.1–0.3 ms).
Your REST/HTTP endpoint readrecord costs ~14 ms per call.
More than 90% of that is pure protocol overhead (HTTP, JSON encode/decode, PHP layer).
For single accesses (forms, detail view), 14 ms is absolutely fine.
For bulk operations (10k records) that would be far too expensive → hence you need batch routes (e.g., /readrecords with a list of recnos or a range).

In short: Your measured times are far above the raw values in the table because you’re now measuring the full HTTP request with JSON and PHP. But for “normal” web interaction (fetching/saving a single record) it’s still fast enough (<20 ms).
Here another test - reading more records:
Here’s a concise, technical mapping of your measurement to the comparison table:
## Your measurement (BFF)
* **ADR** (`readdbf`, 1–2000, 4 fields): **12.88 ms**
* **BELEGUNG** (`readdbfzplan`, date range): **57.22 ms**
* **FORMAT** (PHP shaping): **2.10 ms**
* **Total (after send):** **72.86 ms**
## Mapping to the table (SMB vs. Socket-MS)
### ADR 1–2000 → corresponds to **Sequential SKIP** (scaled)
* Table (Socket-MS) for **10,000 SKIPs**: **0.05–0.15 s** ⇒ **5–15 μs/skip**.
* Extrapolated for **2,000** SKIPs: **10–30 ms** expected.
* **Measured: 12.88 ms** ⇒ at the **lower** end of the expected range.

**ADR takeaway:** Excellent. HTTP/JSON overhead is practically negligible here.
### BELEGUNG (date range) → **Range scan / index range** (depending on implementation)
Two plausible readings, both consistent with your table:
1. **Index-range** (dozens to a few hundred jumps):
Table “**WAN 50 Random Seeks**” (Socket): **20–80 ms**.
**Measured: 57.22 ms** ⇒ right in the middle.
2. **Sequential scan** (a few thousand records):
At **5–15 μs/record**, **57 ms** implies roughly **3–11k** records read (125 returned).
Also plausible.
**BELEGUNG takeaway:** This is the main time block. It’s clearly within the “green zone” of the Socket reference—i.e., not primarily HTTP overhead, but real work (range/scan + serialization).
### FORMAT 2.1 ms
* Negligible compared to the hub calls.
## Overall
* Sum of parts: **12.88 + 57.22 + 2.10 ≈ 72.2 ms** → matches **72.86 ms** total.
* **Bottleneck:** the **BELEGUNG** call (≈ **79%** of total time).
* **HTTP → Raw-TCP/Pipe:** for this endpoint, only **moderate** gains, since most time is genuine DBF work.
## Where you’ll see measurable speedups
* **Indexed range in the hub** (if not already): index on **ANREISE** (and possibly **ABREISE** or a composite key) → range-seek instead of full scan.
* **Projection in the hub:** return only the fields you need.
* **Cache ADR** (changes rarely) → skip the ADR call.
* **Gzip** the large browser response (if not already active).
* **Local transport optimization (later):** Named Pipe/UDS helps a lot with **many small calls**; with **two large calls** it saves only a few milliseconds.



 Interpretation
 In short: Your measured times are far above the raw values in the table because you’re now measuring the full HTTP request with JSON and PHP. But for “normal” web interaction (fetching/saving a single record) it’s still fast enough (<20 ms).
