Text with outlined fonts (hollow fonts):
Code: Select all
METHOD SayText( nRow, nCol, cText, nWidth, nHeight, oFont, cAlign, nClrText, nClrBack, cUnits, nOutLineClr, nPenSize )
If specified, the text is printed with the outline of nOutLineClr with a thickness of nPenSize. If nClrText is a Brush, the text is filled with the brush.
Command:
Code: Select all
@ <nRow>, <nCol> PRINT TO <prn> TEXT <cText> ;
[SIZE <nWidth> [,<nHeight>] ] ;
[<unit: PIXEL,MM,CM,INCHES,SCREEN>] ;
[FONT <fnt>] ;
[ALIGN <aln>] ;
[COLOR <nTxt> [,<nBck> ] ] ;
[OUTLINE <nClr> SIZE <nSize> ] ;
[LASTROW <lrow>] ;
Method RoundBox() was not working correctly. Fixed and enhanced. Methods Box and Ellipse are also enhanced.
Code: Select all
METHOD Box( nTop, nLeft, nBottom, nRight, [uPen], [uBrush], [aText], [cUnits] )
METHOD RoundBox( nRow, nCol, nBottom, nRight, nWidth, nHeight, [uPen], [uBrush], [aText], [cUnits] )
METHOD Ellipse( nTop, nLeft, nBottom, nRight, [uPen], [uBrush], [aText], [cUnits] )
METHOD FillRect( aRect, uBrush, [cUnits] )
uBrush: If specified, fills the area. If omitted, the inner area is left transparent. uBrush can be Brush object, nRGB color or Alpha Color, Gradient Array with RGB and Alpha colors.
aText: Optional array of { text, font, color }. If specified, prints the text at the center of the shape
cUnits: Can be "INCHES", "CM", "MM" or "PIXEL". If omitted, defaults to PIXEL.
New methods:
Code: Select all
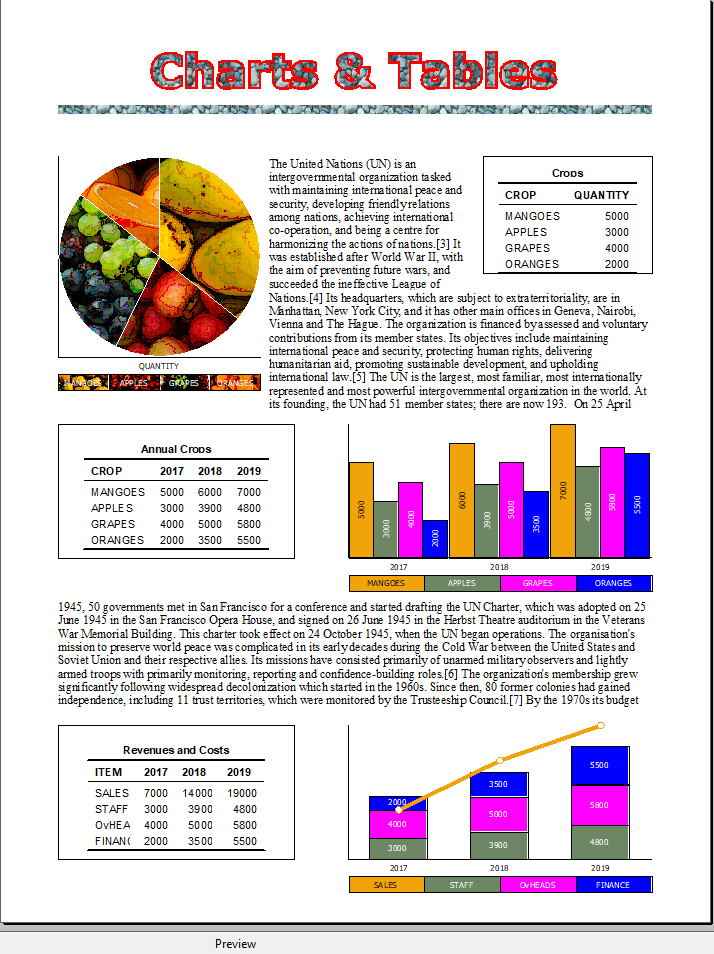
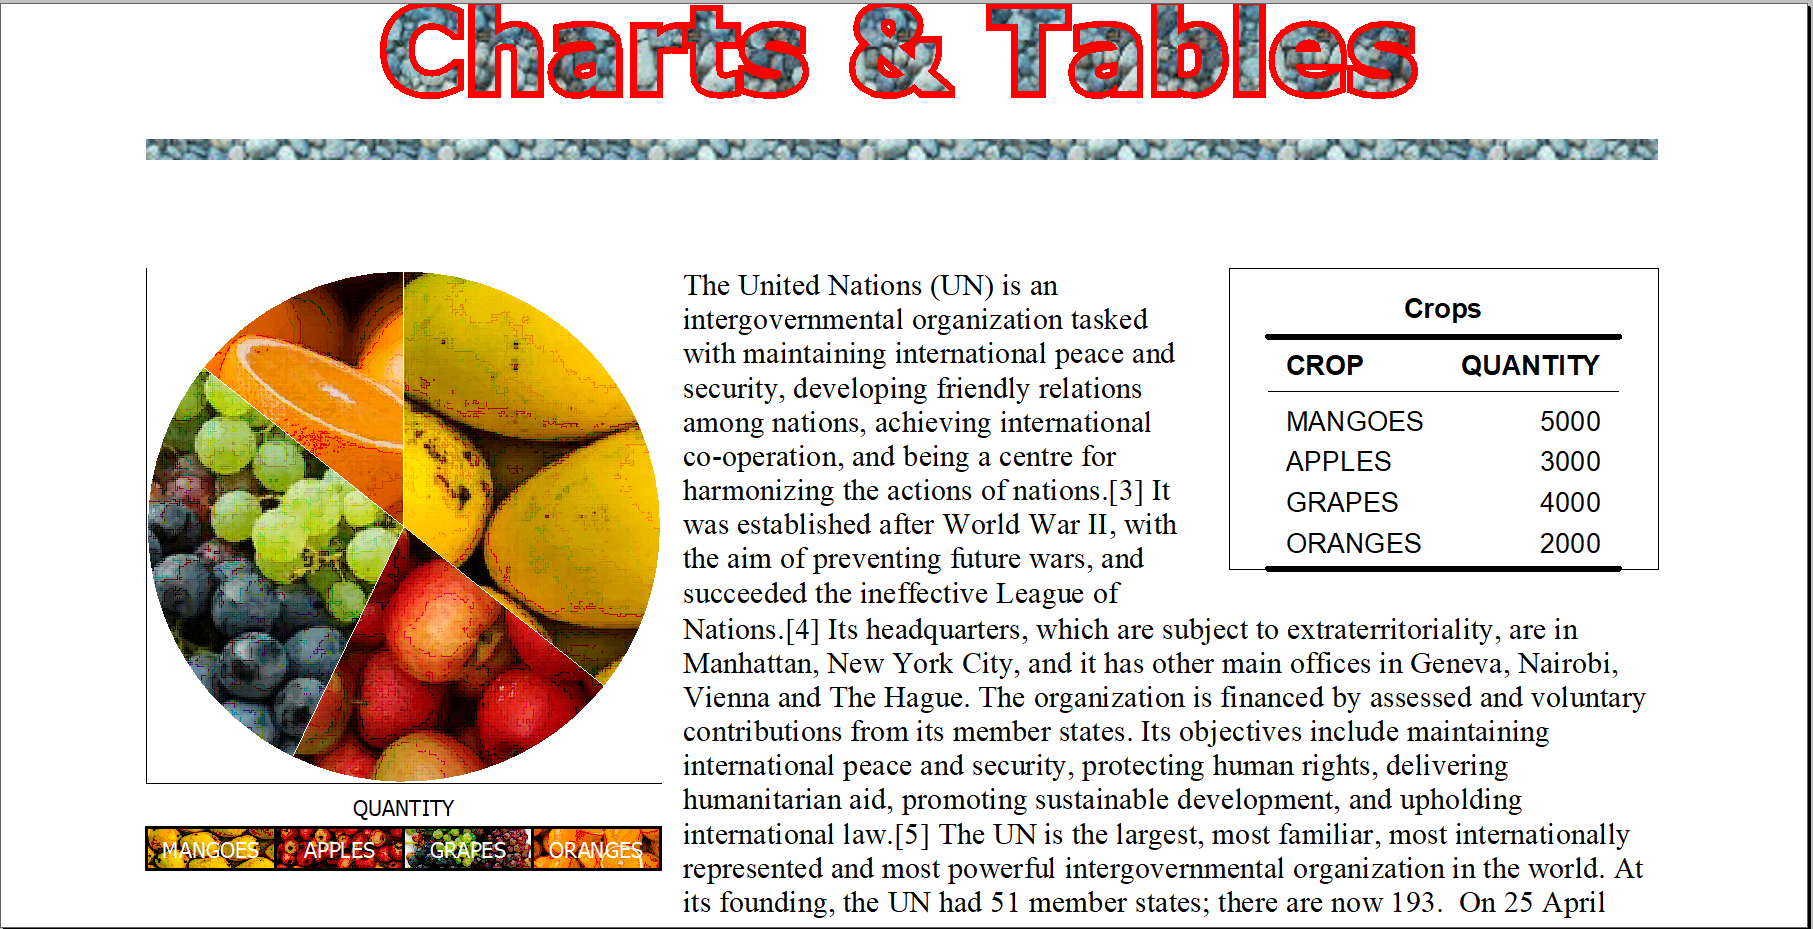
METHOD PieChart( aRect, aValues, [aColors], [aPen], [nStartAngle], [cUnits] )
aColors: Array of colors or Brush objects. If not specified or if any element is nil, default colors are used.
Code: Select all
METHOD PrintTable( nRow, nCol, oTable, nWidth, nHeight, [oFont], [lBorder], [cTitle], [cUnits] )
oTable: Data to the displayed as table. Can be specified as an array or TArrayData object.
Code: Select all
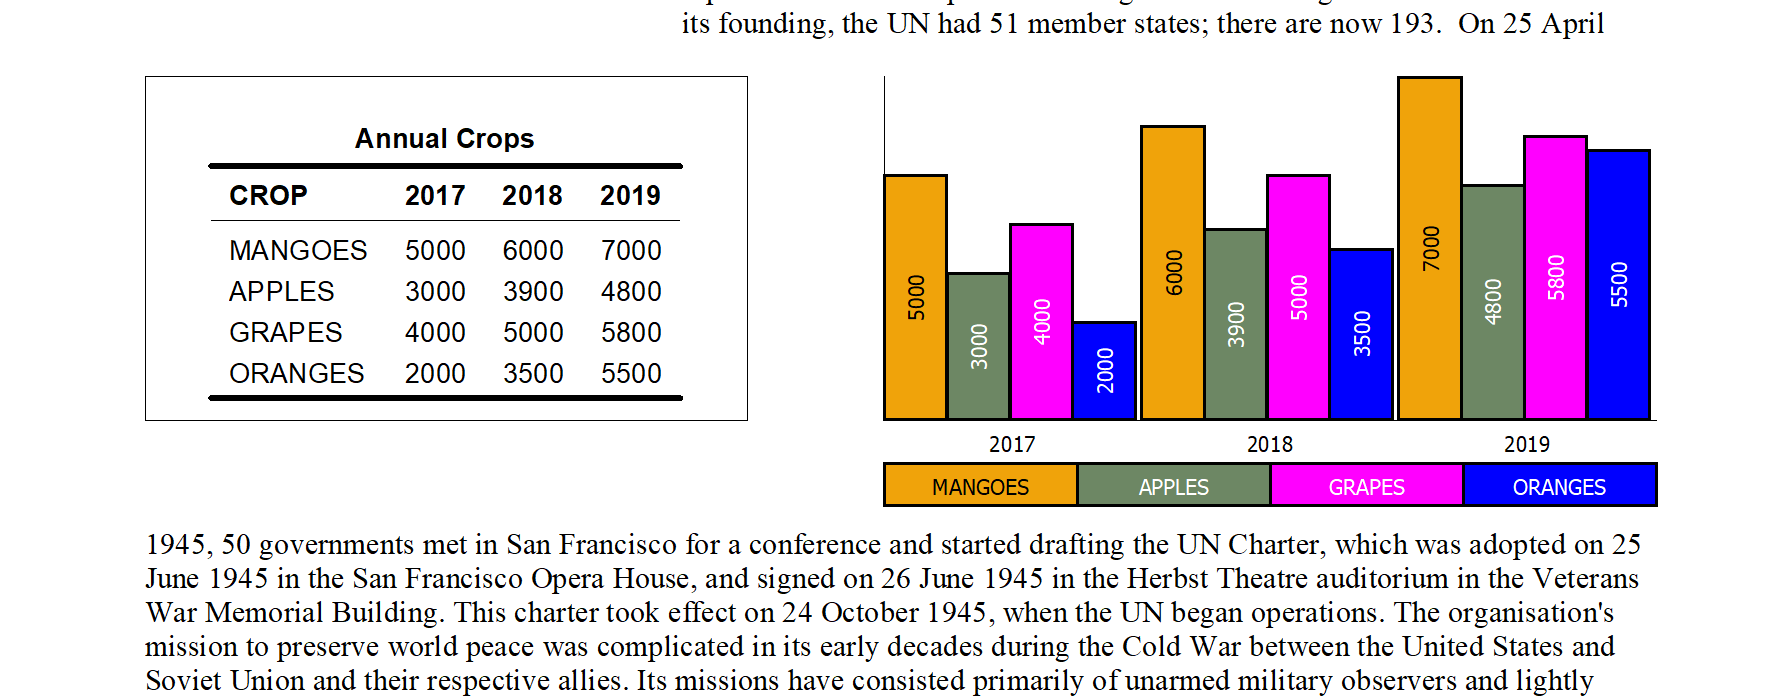
METHOD PrintChart( nRow, nCol, oTable, nWidth, nHeight, cType, [aColors], [cTitle], [cUnits] )
oTable: Data to be charted. Can be an array or TArrayData object.
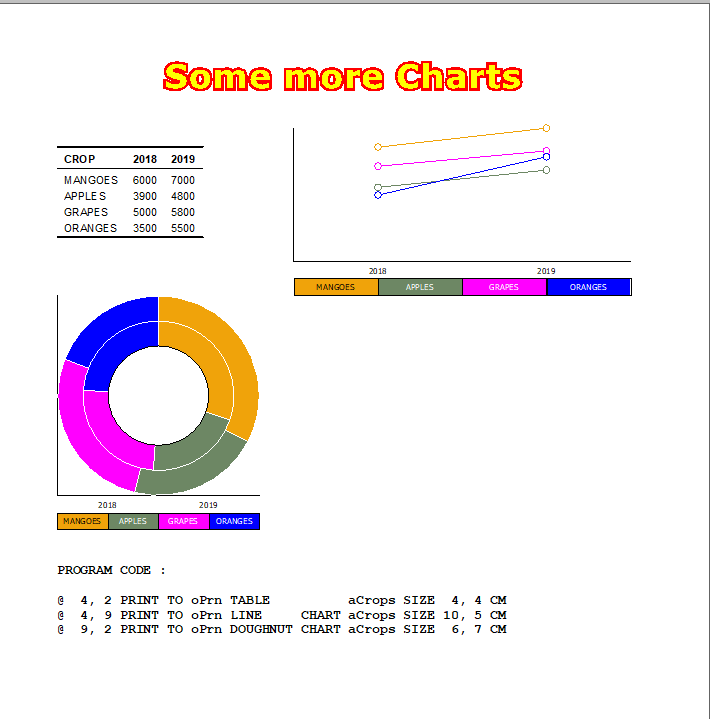
cType: Type of chart. Possible values are "LINE, BAR, PIE, DOUGHNUT, STACK (Stacked Bar), STACKL (Stacked bar with first of the series as Line)"
The above methods are also availabe as commands, which are easier to use.
Code: Select all
<nRow>, <nCol> PRINT TO <prn> ;
      [<ctype: BAR,LINE,STACK,STACKL,PIE,DOUGHNUT>] CHART <otbl> ;
      [SIZE <nWidth> [,<nHeight>] ] ;
      [ COLORS <aClrs,...> ] ;
      [TITLE <title> ] ;
      [<unit: PIXEL,MM,CM,INCHES,SCREEN>] ;

<nRow>, <nCol> PRINT TO <prn> TABLE <otbl> ;
      [SIZE <nWidth> [,<nHeight>] ] ;
      [FONT <ofnt>] ;
      [<lBorder:BORDER>] ;
      [TITLE <title> ] ;
      [<unit: PIXEL,MM,CM,INCHES,SCREEN>] ;
Code: Select all
#include "fivewin.ch"

#define MANGOES "https://img.huffingtonpost.com/asset/5c1225351f0000f00626a771.jpeg?ops=scalefit_630_noupscale"
#define APPLES  "https://cdn.images.express.co.uk/img/dynamic/109/590x/Apple-links-587431.jpg"
#define GRAPES  "https://img-aws.ehowcdn.com/350x235p/s3-us-west-1.amazonaws.com/contentlab.studiod/getty/f36944f5be3843ddafebd89b1dca105f.jpg"
#define ORANGES "https://www.jesmondfruitbarn.com.au/wp-content/uploads/2016/10/Jesmond-Fruit-Barn-Oranges.jpg"

//----------------------------------------------------------------------------//

function Main()

   local oPrn, aFont[ 2 ], aBrush[ 4 ], aBruBG[ 2 ]
   local nPgWidth, nPgHeight
   local aCrops, aAnnual, aRevenue, cText

   aCrops   :=  { { "CROP", "QUANTITY" } ;
                , { "MANGOES",  5000   } ;
                , { "APPLES",   3000   } ;
                , { "GRAPES",   4000   } ;
                , { "ORANGES",  2000   } ;
                }

   aAnnual  :=  { { "CROP",     "2017", "2018", "2019" } ;
                , { "MANGOES",  5000 ,  6000,   7000  } ;
                , { "APPLES",   3000,   3900,   4800  } ;
                , { "GRAPES",   4000,   5000,   5800  } ;
                , { "ORANGES",  2000,   3500,   5500  } ;
                }

   aRevenue :=  { { "ITEM",    "2017", "2018", "2019" } ;
                , { "SALES",    7000 , 14000,  19000  } ;
                , { "STAFF",    3000,   3900,   4800  } ;
                , { "OvHEADS",  4000,   5000,   5800  } ;
                , { "FINANCE",  2000,   3500,   5500  } ;
                }

   cText    := ReadText( 2000 )

   TPreview():bSaveAsPDF := { |O| FWSavePreviewToPDF( O ) }

   DEFINE BRUSH aBruBG[ 1 ] FILE "c:\fwh\bitmaps\backgrnd\wood.bmp"
   DEFINE BRUSH aBruBG[ 2 ] FILE "c:\fwh\bitmaps\backgrnd\pebbles.bmp"

   DEFINE BRUSH aBrush[ 1 ] RESOURCE MANGOES RESIZE
   DEFINE BRUSH aBrush[ 2 ] RESOURCE APPLES  RESIZE
   DEFINE BRUSH aBrush[ 3 ] RESOURCE GRAPES  RESIZE
   DEFINE BRUSH aBrush[ 4 ] RESOURCE ORANGES RESIZE

   PRINT oPrn PREVIEW

   nPgWidth    := oPrn:PageWidth(  "CM" )
   nPgHeight   := oPrn:PageHeight( "CM" )

   DEFINE FONT aFont[ 1 ] NAME "VERDANA" SIZE 0,-40 BOLD OF oPrn
   DEFINE FONT aFont[ 2 ] NAME "Times New Roman" SIZE 0,-10 OF oPrn

   PAGE

   @ 2.0, 2.0 PRINT TO oPrn TEXT "Charts & Tables" SIZE (nPgWidth - 4.0), 1 CM FONT aFont[ 1 ] ;
      COLOR aBruBG[ 2 ] ALIGN "" OUTLINE CLR_HRED SIZE 2

   oPrn:FillRect( { 3.50, 2.0, 3.75, nPgWidth - 2 }, aBruBG[ 2 ], "CM" )

   // Print pie-chart and table for data in aCrops array
   @ 5.0, 2.0 PRINT TO oPrn PIE CHART aCrops SIZE 6.0, 7.0 CM COLORS aBrush
   @ 5.0, nPgWidth - 7.0 PRINT TO oPrn TABLE aCrops SIZE 5.0, 3.5 CM TITLE "Crops" BORDER

   // Print table and bar-chart for data in aAnnual array
   @ 13.0, 2.0 PRINT TO oPrn TABLE aAnnual SIZE 7.0, 4.0 CM TITLE "Annual Crops" BORDER
   @ 13.0, nPgWidth - 11.0 PRINT TO oPrn BAR CHART aAnnual SIZE 9.0, 5.0 CM

   // Print table and StackedBar with Line Chart for data in aRevenue array
   @ 22.0, 2.0 PRINT TO oPrn TABLE aRevenue SIZE 7.0, 4.0 CM TITLE "Revenues and Costs" BORDER
   @ 22.0, nPgWidth - 11.0 PRINT TO oPrn STACKL CHART aRevenue SIZE 9.0, 5.0 CM

   // Print Text
   @  5.0,  8.25 PRINT TO oPrn TEXT @cText SIZE nPgWidth - 15.5,  4.0  CM FONT aFont[ 2 ] ALIGN "TL"
   @  9.0,  8.25 PRINT TO oPrn TEXT @cText SIZE nPgWidth - 10.25, 3.75 CM FONT aFont[ 2 ] ALIGN "TL"
   @ 18.25, 2.00 PRINT TO oPrn TEXT @cText SIZE nPgWidth -  4.0,  3.50 CM FONT aFont[ 2 ] ALIGN "TL"

   ENDPAGE
   ENDPRINT

   AEval( aFont,  { |o| o:End() } )
   AEval( aBrush, { |o| o:End() } )
   AEval( aBruBG, { |o| o:End() } )

return nil

//----------------------------------------------------------------------------//

Enlarged images:


