Jack wrote:Hello,
I have a dialog with a Listbox and a Tgraph .
When i select an other line in the Listbox, i 'd like to repopulate the graph with the values of other records .
How to change the values of the graph ?
Thanks
oGraph:aData contains an array of values. On change of record, just repopulate the array oGraph:aData with new values and call oGraph:Refresh(). It is that simple.
oGraph:aData is a multi-dimensional array. Each element of the array is an array of values for each series.
{ { <series-1 values,,,,,> }, ;
{ <series-2 values,,,,,> }, ;
etc
}
Here is a self-contained working example using TXBrowse and TGraph.
Code: Select all
#include "fivewin.ch"
#include "tgraph.ch"

REQUEST DBFCDX

function main()

   local oDlg, oBrw, oGraph, oFont

   CreateTestDBF()  // Creates test DBF and opens with Alias "SC"

   DEFINE FONT oFont NAME "TAHOMA" SIZE 0,-14
   DEFINE DIALOG oDlg SIZE 900,340 PIXEL FONT oFont ;
      TITLE "XBROWSE LINKED GRAPH"

   @ 10,10 XBROWSE oBrw SIZE 210,150 PIXEL OF oDlg ;
      DATASOURCE "SC" AUTOCOLS ;
      HEADERS "MONTH", "USA", "EUROPE", "ASIA", "USA", "EUROPE", "ASIA" ;
      FASTEDIT LINES NOBORDER

   WITH OBJECT oBrw
      :lHScroll         := .f.
      :lVScroll         := .f.
      :nStretchCol      := 1
      :nMarqueeStyle    := MARQSTYLE_HIGHLROW
      :bClrRowFocus     := { || { CLR_BLACK, RGB(185,220,255) } }
      :cEditPictures    := "9,999"
      :aCols[ 1 ]:cEditPicture := nil
      :SetGroupHeader( "SALES", 2, 4 )
      :SetGroupHeader( "COSTS", 5, 7 )
      :bChange := { || oGraph:cTitY := SC->MONTH, ;
                       oGraph:aData := { { SC->USAS, SC->EUROS, SC->ASIAS }, ;
                                         { SC->USAC, SC->EUROC, SC->ASIAC } }, ;
                       oGraph:Refresh() }
      AEval( :aCols, { |o| o:nEditType := EDIT_GET, ;
                           o:bOnChange := ;
                              { |oc| oGraph:aData[ Int( ( oc:nCreationOrder - 2 ) / 3 ) + 1, ;
                                                   ( oc:nCreationOrder - 2 ) % 3 + 1 ;
                                                 ] := oc:Value, ;
                                                oGraph:Refresh() } ;
                     }, 2 )
      //
      :CreateFromCode()
   END

   @ 10,220 GRAPH oGraph SIZE 200,150 PIXEL OF oDlg ;
      TITLE "Sales and Costs" ;
      XVALUES YVALUES TYPE GRAPH_TYPE_BAR LEGENDS

   oGraph:cTitY      := SC->MONTH
   ADD SERIE TO oGraph SERIE { SC->USAS, SC->EUROS, SC->ASIAS } LEGEND "Sales" COLOR CLR_HRED
   ADD SERIE TO oGraph SERIE { SC->USAC, SC->EUROC, SC->ASIAC } LEGEND "Costs" COLOR CLR_GREEN

   SET Y LABELS OF oGraph TO { "USA", "EUROPE", "ASIA" }

   oGraph:nMaxVal    := 2000

   ACTIVATE DIALOG oDlg CENTERED
   RELEASE FONT oFont

return nil

static function CreateTestDBF()

   local aCols := {  ;
      { "MONTH",     'C',  3, 0  }, ;
      { "USAS",      'N',  4, 0  }, ;
      { "EUROS",     'N',  4, 0  }, ;
      { "ASIAS",     'N',  4, 0  }, ;
      { "USAC",      'N',  4, 0  }, ;
      { "EUROC",     'N',  4, 0  }, ;
      { "ASIAC",     'N',  4, 0  }  }

   local aData := {  { "JAN", 1000, 1200,  900,  400,  700,  400 },  ;
                     { "FEB", 1100, 1300, 1000,  500,  800,  500 },  ;
                     { "MAR", 1050, 1800, 1900,  700, 1400, 1600 }   ;
                  }

   DBCREATE( "SALECOST.DBF", aCols, "DBFCDX", .t., "SC" )
   FW_ArrayToDBF( aData )
   GO TOP

return nil
In the above example, the code which re-populates the graph and repaints is:
Code: Select all
      :bChange := { || oGraph:cTitY := SC->MONTH, ;
                       oGraph:aData := { { SC->USAS, SC->EUROS, SC->ASIAS }, ;
                                         { SC->USAC, SC->EUROC, SC->ASIAC } }, ;
                       oGraph:Refresh() }
You need to adopt this part of the code to suit your data.
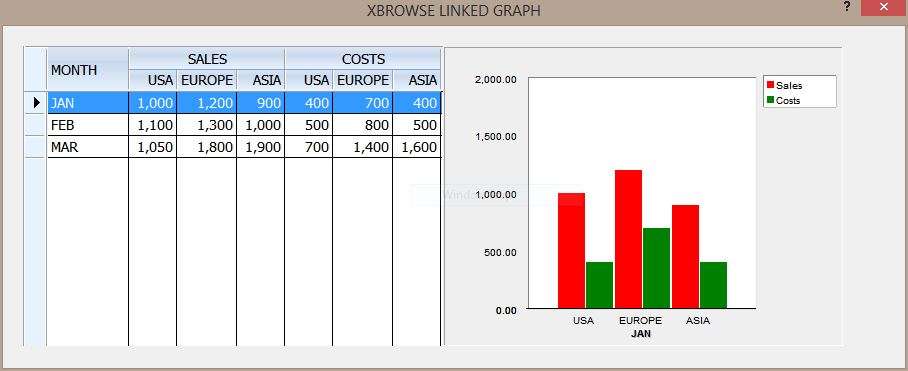
Screen-shot when user is on the first row:

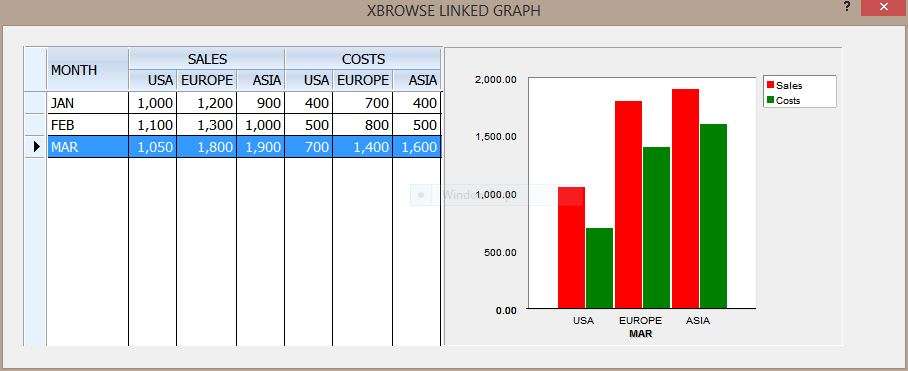
Screen-shot when the user moved to the last row:

I guess this is what you want to do.


